Report Reveals Key Deltas Between Exact-Ad Measurement, Average-Minute Audience
As sports accounts for increasing parts of the traditional TV pie, brands, leagues and networks benefit from a detailed look at the sort of value provided by these live events.
With that in mind, iSpot released a new study – Every Second Counts – to dig into modernized measurement of live sports viewership that shows the key differences when comparing average-minute audience results and exact-ad measurement.
Authored by iSpot Vice President of Sports Insights and Strategy Dave Coletti, Every Second Counts digs into how these differences create new opportunities for all parties to get smarter about how sports ads are bought and sold on TV, and even open up new avenues for growth.
Interestingly enough, Coletti says in the report that his initial hypothesis was that average commercial-minute audience (ACM) and spot-level impressions (SLI) results would be pretty similar for top sports advertisers. But right off the bat, the report shows sizable volatility for each sports’ biggest advertisers between ACM and SLI results…
iSpot found that six of the 15 most-active advertisers across NFL, NBA and MLB games saw meaningful underdelivery at the spot-level, when compared to ACM.
In particular, the second-leading NFL advertiser saw a discrepancy of 169 million impressions (vs. ACM) across pods 22-27 last season – where 31% of its spots ran. Meanwhile, ads in pods 1-21 actually over-delivered by 53 million.
But it’s unlikely these ads were bought on SLI. Using ACM, advertisers clearly become more impacted by blowouts. Game flow is also different from sport to sport, and team to team – which the report shows as a key point for SLI.
Since ACM sees viewership as a static line across a single game, SLI goes deeper into viewing patterns and how they uniquely drive ad delivery — plus how deviations from these patterns trigger ad impression adjustments, and adjusted value buying within certain pods.
iSpot’s game flow chart from last season’s week 1 blowout between the Dallas Cowboys and New York Giants illustrates the stark differences in impression delivery once the contest gets out of hand.
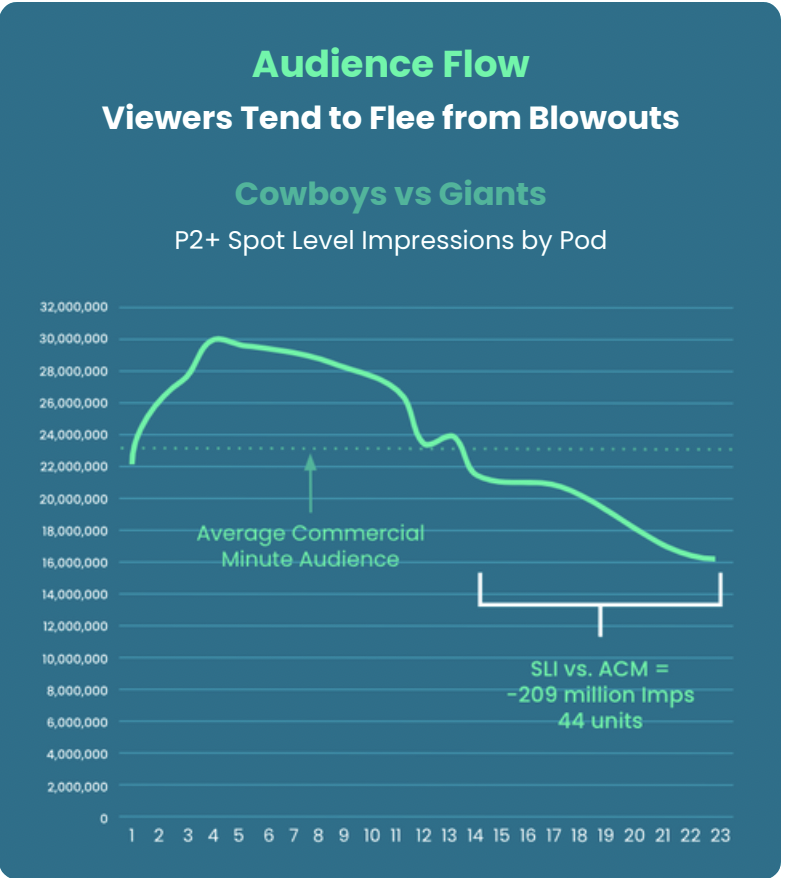
A significant number of advertisers during that game — 36% — only start advertising in pod 14, once the impressions levels dip below the ACM line. Those brands wind up getting fewer impressions for their money during this specific game. Meanwhile, advertisers in pods 1-13 actually get more out of the game than averages would suggest.
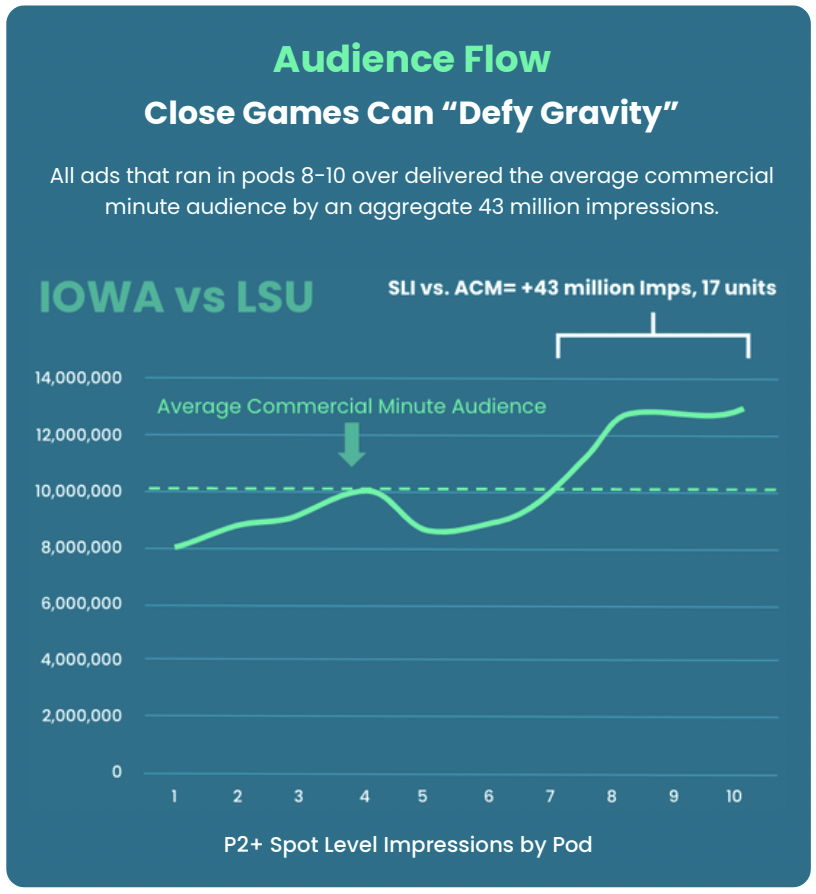
Other sports have different flows, and thus, different dynamics. iSpot cites another game — this spring’s LSU vs. Iowa women’s basketball game — where ad pods 8-10 over-deliver as the game gets more competitive (and early-game audiences were actually lower than the average indicates).
Coletti uncovers a bevy of other insights around time slots, popular teams picking up audiences quicker, and some potentially surprising findings on how sports audiences have better retention on streaming. But the overarching takeaways show that there’s a significant gap right now between what ACM tells the TV industry, and what advertisers and networks are actually getting.
That doesn’t get solved overnight. But examining the greater impact of SLI at least seems to get the conversation started about how to better assess the value of sports for all parties going forward.