Does social video have a “prime time” window? John Cassillo explores.
Christopher Nolan’s ‘The Odyssey’ will undoubtedly be a box office winner. But can it surpass the moneymaking highs of ‘Oppenheimer?’
PLUS: ChatGPT’s ads thing, freeing the airwaves, audits and accreditation, and more
Comedies have shrunk as part of TV and movies, but they’re still alive and well on YouTube, as data from Tubular shows.
Most major films generate strong interest. Only some convert it into urgency. A look at why box office outcomes diverge even when audiences are paying attention.
PLUS: ChatGPT’s ads thing, freeing the airwaves, audits and accreditation, and more
Bad Bunny’s Gen Z appeal is a big part of the NFL’s larger efforts to get younger, and stay ahead of the streaming curve.
As AI-fueled video floods YouTube, brands chasing efficiency risk alienating consumers — and undermining YouTube’s push to win TV ad dollars.
A look at the increasing footprint of creators during the Super Bowl, as the NFL and advertisers invite digital video further into its domain.
Hollywood continues to misunderstand the economics of sequels, leaving industry execs scratching their heads over the front-loaded box office.
PLUS: Surviving the distraction economy, Alan Wolk’s Week in Review, and eliminating the FCC.
A&E isn’t shying away from the evolving way audiences are tuning in, embracing YouTube in a way that brings their programming directly to where viewers are.
PLUS: Alan Wolk on the Media Odyssey Podcast and more.
Disney+ is embracing short-form. But is it really just embracing owned video?
Not every film needs theatrical urgency to monetize. Audience behavior reveals which genres demand theaters—and which hold value beyond them.
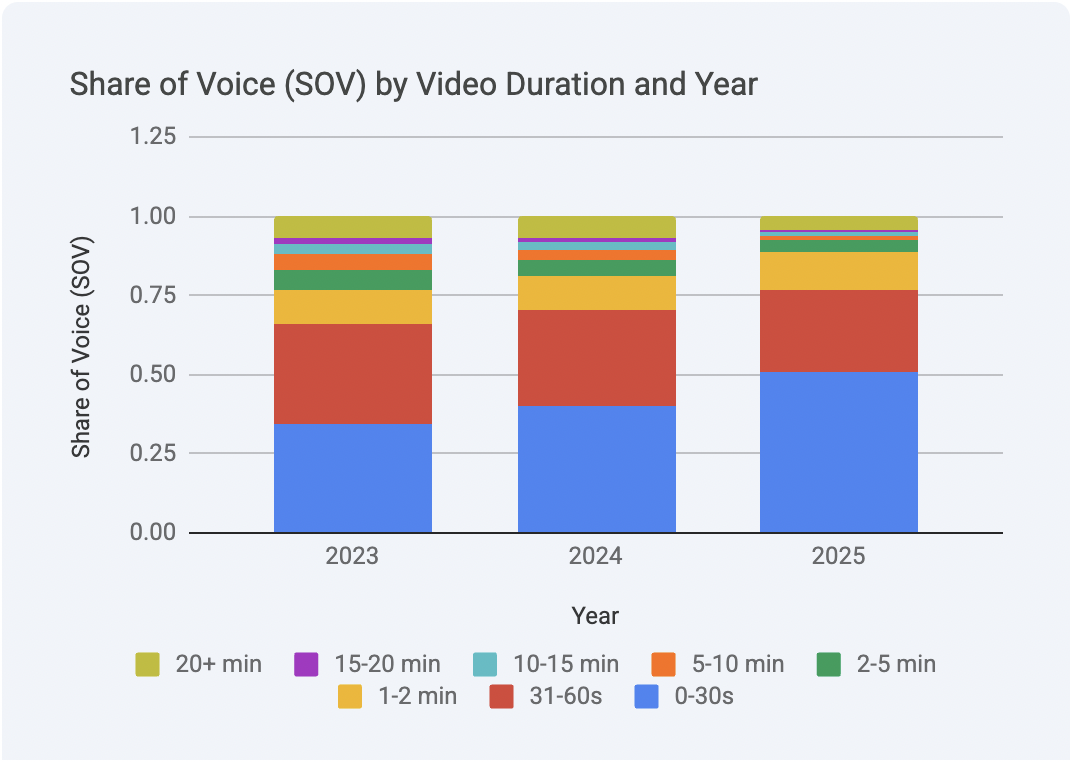
Over three quarters of YouTube views came via short-form videos last year, as data from Tubular Labs highlights.
PLUS: TikTok is digital North Korea and PBS stations going independent
‘Avatar: Fire and Ash’ opened 34% smaller than ‘The Way of Water’ at the box office. That’s hardly a disaster, but it’s worth examining further.
YouTube taking over the Oscars broadcast changes how big events reach a broad TV audience (as YouTube expands itself further as a traditional TV alternative).
Film genres all fall under the larger umbrella of movie entertainment, but do they behave differently when you examine how audiences respond to them? A recent study revealed key advantages and vulnerabilities that offer plenty of practical takeaways.
PLUS: Alan Wolk looks at what porn can teach us about the future of AI, Jesse Redniss on Disney’s OpenAI deal, and more
One of the biggest assets in a potential Netflix acquisition of Warner Bros. could be its enormous YouTube audience.
TikTok users are not monolithic, even as parents may assume that’s the only activity their kids engage with all day every day. These users are the mainstream social media audience. The notion that “TikTok kids” operate as a segmented, isolated cohort is inherently false.
This year, retailers appear to be using YouTube much like they use traditional TV — making a lot of noise despite competition. But it’s paying off, at least when it comes to views.
With holiday shopping season already in full swing, Kohl’s is showing how to succeed early by using social video (and specifically, YouTube).
PLUS: Alan Wolk takes on the death of the sitcom, hear from LG’s Keith Norman, and don’t forget to download our new local TV report
Should brands be investing in Longs? Data reveals it’s an uphill battle on YouTube — but so is the overcrowded Shorts space.
PLUS: TVREV’s new report on local, Alan Wolk on polling and the brand conundrum, hear from Premion’s Daniel Spinosa and Comscore’s Melinda Gladnick
TVREV’s new report on local, Alan Wolk on Paramount, AI creators, and more.
Jimmy Kimmel’s return has put up bigger numbers on late night TV, but those figures (and its potential relevance) get even bigger when looking at social video.
Data & Measurement
Reports, studies, and data-focused stories on the stats driving the evolution of TV programming and advertising.


